Forex trading signals result for november, 300+ pips.
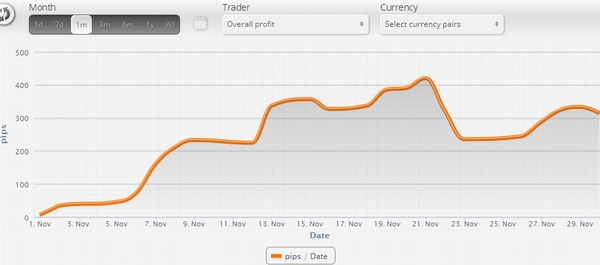
Forex trading signals result for november, 300+ pips.
If you are thinking of or currently investing in forex trading, you will find some valuable information in this article about a common chart formation. This is the forex double top formation and it’s used to predict price movements. Once you are a forex trader, you should know about important things such as support, resistance and candlesticks.
A double top can be described as a reversal chart pattern that has proven to be extremely reliable for many forex traders. This pattern is the most common in forex trading, because it shows up enough to contradict those who suggest that price movements are unpredictable and random. The price stops often at the top points, so they are far from being random. The primary features of this pattern are its two peaks or tops, which are positioned almost at the same height.
Traders in the financial industry use an exponential moving average (EMA) as a technical indicator to study the price charts of foreign currency, commodities, stocks and other financial products. For the Forex exponential moving average, more emphasis is placed on the latest prices in the calculation, so it’s more than just a formula for a simple average. Many Forex trading strategies are designed to work from different EMA combinations. Read on to find out more.
In trading terms, a moving average indicator is used to summarize different prices during a certain time period. This information is then reflected as a line on a bar chart that the trader can view easily on a computer screen. Since the EMA indicator will give more weight to the latest price actions, the average provided will be skewed towards the current market conditions.
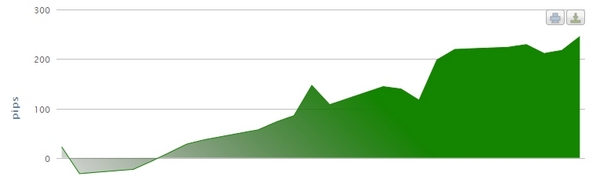
Forex trading signals result for october, make 200+ pips. Not bad.
Yapon Şamdan - bazarları təhlil etmək üçün qədim bir üsuldur. Bu üsul əvvəlcə bir çox əsr əvvəl Yaponiyada düyü ticarətində istifadə edilmişdir, lakin, XX əsrin sonlarında qərb dünyasında tətbiq olunmağa başladı. Yapon Şamdan analizi, indi Forex ticarətinə yeni gələnlərin kəmərlər altına girmələrinin ən yaxşı metodlarından biridir.
Yəqin ki, Yapon Şamdanı ilə əlaqədar örtməli olduğumuz ilk şey onları necə formalaşdırmaqdır. Çətin bir metod olsa da, narahat olmayın, etmək çox çətin deyil. İdeal olaraq burada söylədiklərimdən bir az daha çox araşdırma aparacaqsınız.
Bir Forex Yapon Şamdanı istədiyiniz istənilən vaxt üçün çəkilə bilər. Misal üçün, bir gün ərzində çəkə bilərsiniz, bir ay, hətta bir saat (əlbəttə ki, bunu etsəniz tez olmalısınız!). Bu, Forex yapon şamdanını çəkmək üçün necə gedir.
Forex Support and Resistance Levels are one of the most important things to grasp when you first start trading on the Forex Platform. Faktiki olaraq, grasping this concept could result in untold gains for yourself monetary wise as it will enable you to start to plan your own financial strategies. Sadly there isn’t enough space here to cover Forex Support and Resistance Levels in depth, but I am more than happy to give you a brief overview.
Let’s start simply with a brief definition of what the definition actually is. To put it as simply as possible, Forex Resistance levels are when the market has moved up to the highest possible point and then starts to ‘fall back’, the highest possible point is known as resistance. As you can probably guess, the lowest possible point that it reaches is known as the Forex Support levels.
The Forex or foreign currency exchange market is currently one of the largest in the global financial markets. Traders who take part in this market aims to earn huge profits when the exchange rates fluctuate quickly. In an effort to predict the price changes, the traders usually apply various technical indicators to Forex charts. Of all the technical indicators, the simple moving averages are among the most popular today.
First and foremost, you should know that the technical indicators are really preprogrammed formulas which use price actions in the past to determine the performance of a Forex currency. When traders apply the indicators to a Forex price chart, they will appear beneath or overlaid the chart.
In most financial markets, one of the most technical indicators to date is the RSI Relative Strength Index. This indicator is primarily used in charting the strength and weakness of both the past and current state of the stock or market, in general. The closing prices of stocks in the most recent trading period shall also be taken into consideration as part of the overall analysis of the financial market.
It is considered as an oscillator which is used to measure the momentum of the price movements of stocks within the given period. The ratio of higher closes to lower closes is defined by RSI as the momentum. The RSI therefore calculates the momentum of certain stocks by identifying their positive and negative changes; so that the stocks get a higher RSI if they have had stronger positive changes in a particular time frame. Otherwise, the stocks get a lower RSI.
Forex trading is more and more present. Some of the reasons are high liquidity and a much higher earnings potential. Most traders keep in their portfolio a percentage that is strictly dedicated to this activity. With high earning potential also comes a bigger risk but it can easily be covered with the right information and intuition. Foreign exchange is a relatively new market that can be easily accessed with the help of software platforms that are increasingly more and more accurate.
But in order to eliminate risk as much as it’s possible the investor must arm him/herself with information and patience. In this article I’m going to talk a little bit about the Fibonacci indicator.
The Forex Market began as an inter banker exchange program that was used to transform currencies. Even the roots of the word explain the significance of it: Xarici valyuta. Soon after it began the Forex market attracted many traders because mainly of the high liquidity and high earning potential. Although the risk is higher than any other types of trading it grew to 1490 trillion dollars in spot transaction and a total of almost 3000 trillion dollars in other transactions being the biggest trading markets ever to exist.
To avoid risks there have been developed theories and indicators that help the trader calculate and minimize them. In the trader world the Pivot Points Indicator is one of the most important tools that any trader should know and use. But what is the pivot point indicator? This particular indicator shows the level (the line) where the general trend of the day switches its direction. Using a few mathematical calculus and the maximum and minimum prices of the previous day we could foresee and derive the series of this pivot. For the more these points can be considered support and critical resistance levels of that day that will become the pivot levels. Each day traders use Open, Close, High and Low prices (the Forex Market that is considered to be open 24 hours uses as Open/Close prices the prices at 5 pm EST or 2 pm PST). This data is enough to calculate the level of the pivot point indicator. Pivotun səviyyəsi o qədər populyardır ki, asanlıqla proqnozlaşdırıla bilən səviyyələrdir və trend keçidinin potensial səviyyələrini tapmaq üçün ötən günlərin məlumatlarını istifadə edərək ticarət günündə qərar vermək çox faydalıdır.. You should also keep in mind that if most traders know this method you can expect the market to be too predictable and that the effects of this strategy to de diminished or heightened. Also I’m thinking that among small investors are found big ones that use this classic method knowing this but forcing and anticipating these movements in the market with the proper consequences.
This is why these simple deductions of the levels of the pivot point indicator can be seen as opportunities to invest especially in a highly volatile market like Forex.
| Android | Windows | Makintoş |
 Android Tətbiqi Yükləmə |
 Windows Proqram Yükləmə |
 Mac Proqram Yükləmə |


")
")


